 |
|
|
|
Cash Bids
Market Data
News
Ag Commentary
Weather
Resources
|
Is Silver Going to Break Out on the Upside?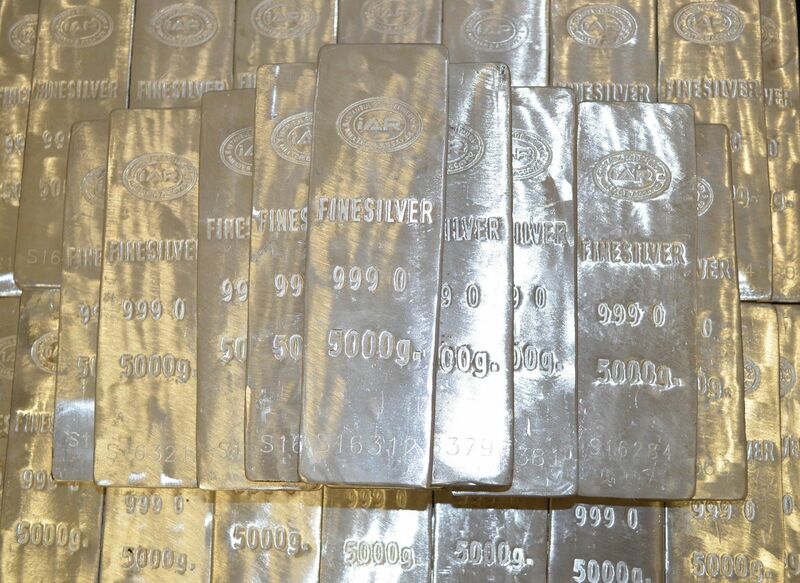
In a Barchart article on silver dated April 1, I drew attention to the falling silver-gold ratio, a bullish signal for silver, known for its volatility and speculative nature among precious metals. I stated: The silver-gold ratio is trading at an elevated level on April 1, which is a mixed blessing. On the one hand, the metric tells us that silver continues to underperform gold. However, the high level could create a significant opportunity if silver is heading for an upside break that could take the volatile metal substantially higher over the coming months. I favor the upside for silver and believe each price correction is a buying opportunity. The ratio was near 90:1 on April 1 and declined to below 83:1 at the most recent low, reflecting silver’s outperformance compared to gold over the past weeks. Meanwhile, on April 1, nearby May COMEX silver futures were trading at $25.075 per ounce. Since then, the May contract rose 19.3% to a $29.905 high on April 12 before correcting. Silver rallies and comes to life While gold rallied over 7% in Q1 2024 and silver was up 3.45%, early Q2 has been another story as silver has taken the leadership baton. At the latest $2,448.80 high on April 12, June gold futures moved 9.4% higher than at the end of March, while May silver futures reached $29.905 per ounce, a 20% increase from the Q1 closing level. 
The six-month chart highlights silver’s impressive rally that took the price over the short-term technical resistance level at the December 4, 2023, $26.575 high. Approaching the first technical resistance level at the February 2021 high The technical price action on the medium-term chart is even more impressive. 
The five-year weekly chart shows that the continuous silver futures contract moved within 35.50 cents of the February 2021 peak at $30.16 per ounce, the critical technical resistance level. A gateway to the 2011 and 1980 peaks The long-term chart highlights that a move above the February 2021 high could be a technical gateway to much higher silver prices. 
The long-term chart, dating back to the early 1970s, shows technical resistance at the 2011 $49.52 high and the record 1980 $50.36 peak. A move above the 2021 high could ignite a parabolic rally in the silver futures market as trend-following traders, speculators, and investors buy silver with expectations of much higher prices. The factors supporting silver The factors supporting a significant rally in the silver futures market are:
Even the most aggressive bull markets rarely move in straight lines; pullbacks and corrections are likely. However, silver has the fundamental wind behind its bullish sails, and a break above the February 2021 high would put a technical gust into those sails, which could trigger a significant upside move. SLV is the leading silver ETF product that tracks the metal’s price The most direct route for a silver investment is the physical market for bars and coins. However, a 1,000-ounce bar worth just under $30,000 weighs about seventy pounds. Therefore, silver is bulky and challenging to store. COMEX futures and options offer another investment and trading avenue, but involve special trading accounts, leverage, and margin. The most liquid silver ETF product is the iShares Silver Trust (SLV). SLV purports to hold physical silver bullion. At $24.83 per share, SLV had over $11.755 billion in assets under management. SLV trades an average of over 41 million shares daily and charges a 0.50% management fee. The latest rally in COMEX May silver futures took the price 34.77% higher from $22.19 on February 14, 2024, to $29.905 on April 12, 2024. 
Over around the same period, SLV rose 35.5% from $20.11 to $27.24 per share. While SLV does an excellent job tracking silver futures prices, it has one drawback. Silver trades around the clock, while SLV is only available during U.S. stock market hours. Therefore, SLV can miss highs or lows occurring when the stock market is not operating. The case for rising silver prices remains compelling as it approaches its critical resistance at just over the $30 per ounce level. Despite the correction, silver could be the next commodity to experience a parabolic rally. On the date of publication, Andrew Hecht did not have (either directly or indirectly) positions in any of the securities mentioned in this article. All information and data in this article is solely for informational purposes. For more information please view the Barchart Disclosure Policy here. |
|
|